


Climate change has led to unpredictable weather conditions. There are many weather stations around the world that are used by researchers and government agencies to observe, record, and analyze weather patterns to study climate changes and provide weather forecasts. These Weather stations are highly advanced and can, not only tell the current weather condition but also tell the predictions about the upcoming weather. Basically there are three major parameters to measure in any weather station- Humidity, Temperature, and Pressure. We previously built few IoT weather stations using Arduino, Raspberry Pi and ESP32 and published the weather data on various cloud platforms like IBM Watson, ThingSpeak, Local webserver etc.
Here in this project, we will build a NodeMCU based Weather Station, and analyze and visualize weather streaming data like temperature, humidity using the ThingSpeak MATLAB analysis and visualization tool. Here a DHT11 sensor will be used to collect the real-time temperature and humidity data.
MATLAB Analysis and Visualization
ThingSpeak has integrated support from the MATLAB. It allows ThingSpeak users to analyze and visualize live data using MATLAB without any MATLAB license from Mathworks. You can access the MATLAB tools from your ThingSpeak channel.
MATLAB Analysis and Visualization tools can show relationships, patterns, and trends in data, and can visualize it in plots, charts, and gauges.
Using the MATLAB analysis, you can:
- Convert the data units, combine different data, and calculate new data.
- Schedule calculations to run at a specific time.
- Visually understand relationships in data using built-in plotting functions.
- Combine data from multiple channels to build a more sophisticated analysis.
Components Required
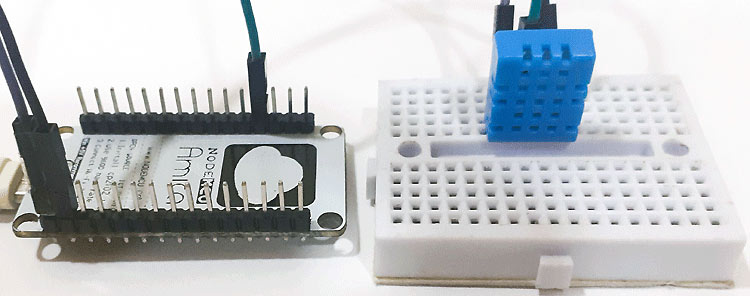
- NodeMCU ESP8266
- DHT11 Sensor
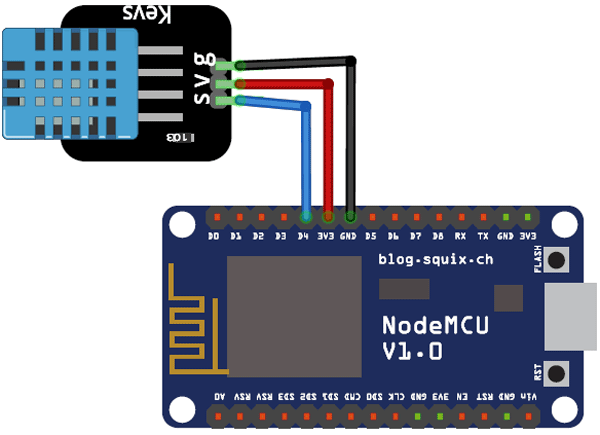
Circuit Diagram
ThingSpeak Setup for MATLAB
ThingSpeak is an open data platform that allows you to aggregate, visualize, and analyze live data in the cloud. You can control your devices using ThingSpeak, you can send data to ThingSpeak from your devices, and even you can create instant visualizations of live data, and send alerts using web services like Twitter and Twilio. ThingSpeak has integrated support from the numerical computing software MATLAB. MATLAB allows ThingSpeak users to write and execute MATLAB code to perform preprocessing, visualizations, and analyses. ThingSpeak takes minimum of 15 seconds to update your readings. We have also done other interesting projects with ThingSpeak like
- NodeMCU Temperature and Humidity Monitoring
- ESP32 Temperature and Humidity Monitoring
- Sending data to ThingSpeak could using Raspberry Pi
Step 1: ThingSpeak Account Setup
To create channel on ThingSpeak first you need to Sign up on ThingSpeak. In case if you already have an account on ThingSpeak, sign in using your id and password.
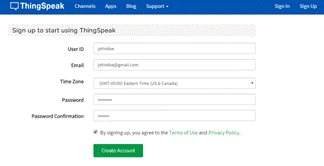
For creating your account go to www.thinspeak.com

Click on Sing up if you don’t have an account and if you already have an account click on sign in. After clicking on signup fill your details.
After this verify your E-mail id and click on continue.
Step 2: Create a Channel for Your Data
Now, after login, create a new channel by clicking the “New Channel” button.
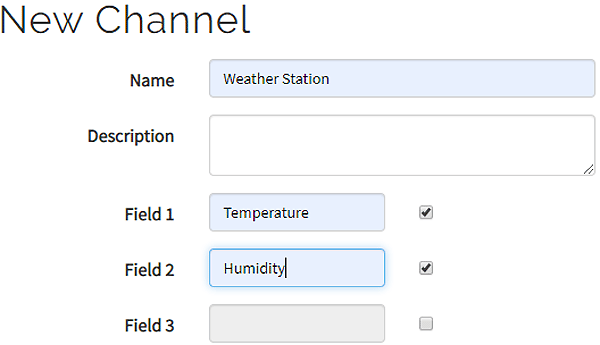
After clicking on “New Channel,” enter the Name and Description of the data you want to upload on this channel. For example, I named it as “Weather station”
Enter the name of your data in Field1 and Field2. If you want to use more than two Fields, then check the box next to the Field option and enter the name and description of new data.
After this, click on the save channel button to save the details.
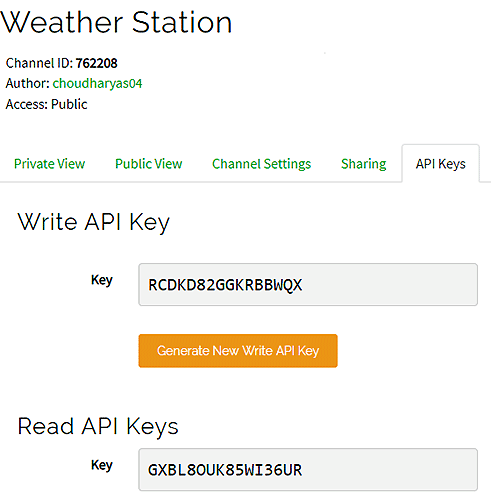
Step 3: API Key
To send data to ThingSpeak, we need a unique API key, which we will use later in our code to upload our sensor data to Thingspeak Website.
Click on the “API Keys” button to get your unique API key for uploading your sensor data.
Code Explanation
Complete code for MATLAB ThingSpeak visualization is given at the end of this document. Here we are explaining the code for better understanding.
In this code, we are using the DHT11 sensor library and ThingSpeak library. So first download and install the ThingSpeak library from here.
The code starts by including the libraries for DHT11, ThingSpeak, and ESP8266 Wi-Fi. ThingSpeak library is used to send data to the ThingSpeak platform. Few variables are defined to store ThingSpeak API key, Wi-Fi name, password and ThingSpeak channel no.
#include <DHT.h>
#include <ESP8266WiFi.h>
#include <WiFiClient.h>;
#include <ThingSpeak.h>;
// replace with your channel’s thingspeak API key,
const char * myWriteAPIKey = "Write API key";
unsigned long myChannelNumber = 762208; //Replace it with your channel ID
const char* ssid = "WiFi Name";
const char* password = "WiFi Password";
Inside the void loop function dht.readHumidity(), dht.readTemperature() functions are used to read the temperature and humidity data from DHT11 sensor. Then temperature and humidity data are published to the ThingSpeak channel using the ThingSpeak.writeField function.
void loop() {
float h = dht.readHumidity();
float t = dht.readTemperature();
if (isnan(h) || isnan(t)) {
Serial.println("Failed to read from DHT sensor!");
}
Serial.print("Temperature: ");
Serial.print(t);
Serial.print(" degrees Celcius Humidity: ");
Serial.print(h);
Serial.println("% send to Thingspeak");
ThingSpeak.writeField(myChannelNumber, 1,t, myWriteAPIKey);
ThingSpeak.writeField(myChannelNumber, 2,h, myWriteAPIKey);
}
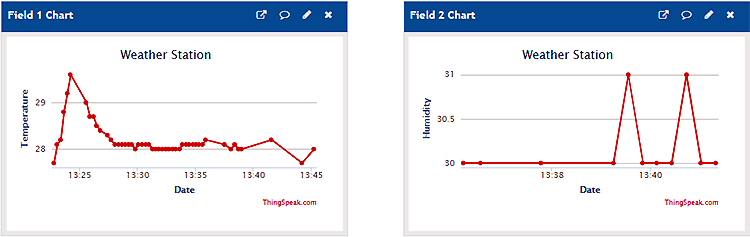
After uploading the code into NodeMCU, you can check the real-time temperature and humidity data on your ThingSpeak channel.
Now, as the sensor data is streaming over the ThingSpeak channel, we will use the MATLAB Analysis tool to calculate the Dew point using the temperature and humidity data. It reads the temperature and humidity data from the Weather Station channel. After calculating the Dew point, write this data to a new channel along with temperature and humidity data.
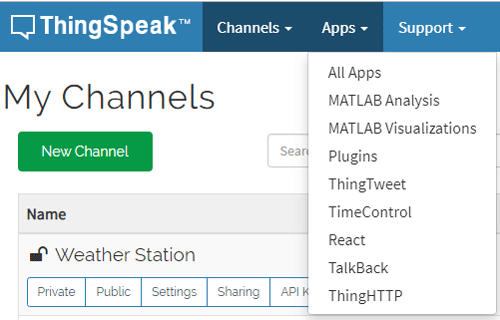
For MATLAB analysis, go to the Apps tab, and click MATLAB Analysis.
Now click on ‘New.’ Then select the Custom template, and click on ‘Create.’ In the Name field, enter your project name.
ThingSpeak MATLAB Analysis
MATLAB code for analysis is given below.
readChannelID = 762208; % Channel ID from which you are reading the data
readAPIKey = 'GXBL8OUK85WI36UR'; % Channel read API key from which you are reading the data
TemperatureFieldID = 1; % Temperature Field ID
HumidityFieldID = 2; % Humidity Field ID
[temp,time] = thingSpeakRead(readChannelID,'Fields',TemperatureFieldID, ...
                                                'NumPoints',1,'ReadKey',readAPIKey); % Read the temperature data
humidity = thingSpeakRead(readChannelID,'Fields',HumidityFieldID, ...
                                                'NumPoints',1,'ReadKey',readAPIKey); % Read the humidity data
tempC = (5/9)*(temp-32);
b = 17.62; % constant for water vapor (b)
c = 243.5; % constant for barometric pressure (c).
gamma = log(humidity/100)+b*tempC./(c+tempC);
dewPoint = c*gamma./(b-gamma)
dewPointF = (dewPoint*1.8) + 32;
display(dewPointF,'Dew Point is');
writeChannelID = 899642; % Write channel ID
writeAPIKey = '5VI7OCQWBB86DK77'; % Write channel API Key
thingSpeakWrite(writeChannelID,[temp,humidity,dewPointF],'Fields',[1,2,3],'timestamp',time,'WriteKey',writeAPIKey);
A brief explanation about the code is given below. First Enter the read channel ID and API Key so that it can read the channel data.
readChannelID = 762208;
readAPIKey = 'GXBL8OUK85WI36UR'
Now enter the temperature and humidity data field no. In my case, I saved the temp. Data in field 1 and humidity data in field 2.
TemperatureFieldID = 1;
HumidityFieldID = 2;
Read the temperature and humidity data from the field 1 & 2 with a timestamp.
[temp,time] = thingSpeakRead(readChannelID,'Fields',TemperatureFieldID, ...
                                                'NumPoints',1,'ReadKey',readAPIKey);
humidity = thingSpeakRead(readChannelID,'Fields',HumidityFieldID, ...
                                                'NumPoints',1,'ReadKey',readAPIKey);
Change the temperature reading from Fahrenheit to Celsius.
tempC = (5/9)*(temp-32);
Enter the constants water vapor (b) and barometric pressure (c) constants.
b = 17.62;
c = 243.5;
Calculate the dew point using temperature and humidity readings.
gamma = log(humidity/100)+b*tempC./(c+tempC);
dewPoint = c*gamma./(b-gamma)
dewPointF = (dewPoint*1.8) + 32;
Enter the write channel ID and API key.
writeChannelID = 899642;
writeAPIKey = '5VI7OCQWBB86DK77';
Write the data to another channel. It will write the dew point data along with temperature and humidity.
thingSpeakWrite(writeChannelID,[temp,humidity,dewPointF],'Fields',[1,2,3],'timestamp',time,'WriteKey',writeAPIKey);
Now click on ‘Save and Run’ and check the output field. Now check the Dew point Measurement channel.
This analysis runs only when we click on ‘Save and Run.’ To schedule the analysis, you can use the ‘Time Control App.’ You can find the ‘Time Control’ option at the bottom of the page.
ThingSpeak MATLAB Visualization
After calculating the Dew point using MATLAB Analysis, now we will use the MATLAB Visualizations tool to visualize the measured data, i.e. dew point, temperature, and humidity.
For Visualization Go to Apps and then click on MATLAB Visualizations. After that, click on ‘New’ to create a visualization.
MATLAB code for Visualization is given below.
readChId = 899642
readKey = 'FGONJCQYKNSZ5PSQ';
[dewPointData,timeStamps] = thingSpeakRead(readChId,'fields',[1,2,3],...
    'NumPoints',100,'ReadKey',readKey);
plot(timeStamps,dewPointData);
xlabel('TimeStamps');
ylabel('Measured Values');
title('Dew Point Measurement');
legend({'Temperature','Humidity','Dew Point'});
grid on;
Here we are explaining the above code in detail. First enter the read channel ID and API Key.
readChId = 899642
readKey = 'FGONJCQYKNSZ5PSQ';
Read data from your Read channel fields, and get the last 100 points of temperature, humidity, and dew point data.
 [dewPointData,timeStamps] = thingSpeakRead(readChId,'fields',[1,2,3],...
    'NumPoints',100,'ReadKey',readKey);
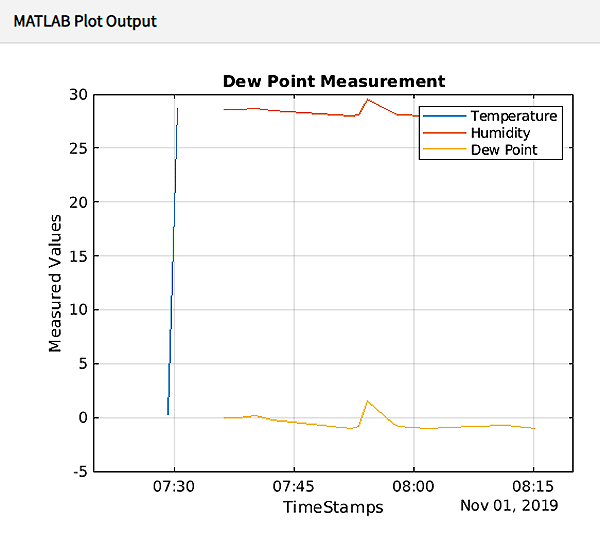
Plot the graph with TimeStamps data on x label and Measured Values on y label, a title, and a legend. Legend used to create a legend with descriptive labels for each plotted data line.
plot(timeStamps,dewPointData);
xlabel('TimeStamps');
ylabel('Measured Values');
title('Dew Point Measurement');
legend({'Temperature','Humidity','Dew Point'});
grid on;
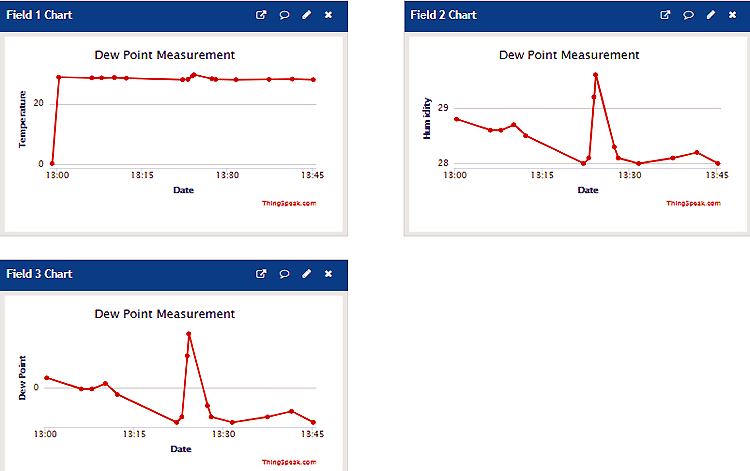
Now click on ‘Save and Run’ and check the output field. Output plot looks like this:
This is how you can use MATLAB Analysis and Visualization tools in ThingSpeak. Apart from calculating the Dew Point, you can calculate average humidity and temperature, high and low-temperature levels, and can analyze how temperature behaved on a particular day/month.
#include <DHT.h>
#include <ESP8266WiFi.h>
#include <WiFiClient.h>;
#include <ThingSpeak.h>;
// replace with your channel’s thingspeak API key,
const char * myWriteAPIKey = "Write API key";
unsigned long myChannelNumber = 762208; //Replace it with your channel ID
const char* ssid = "WiFi Name";
const char* password = "WiFi Password";
const char* server = "api.thingspeak.com";
#define DHTPIN D4 // CONNECT THE DHT11 SENSOR TO PIN D4 OF THE NODEMCU
DHT dht(DHTPIN, DHT11,15); //CHANGE DHT11 TO DHT22 IF YOU ARE USING DHT22
WiFiClient client;
void setup() {
Serial.begin(9600);
delay(10);
dht.begin();
ThingSpeak.begin(client);
WiFi.begin(ssid, password);
Serial.println();
Serial.println();
Serial.print("Connecting to ");
Serial.println(ssid);
WiFi.begin(ssid, password);
while (WiFi.status() != WL_CONNECTED) {
delay(500);
Serial.print(".");
}
Serial.println("");
Serial.println("WiFi connected");
}
void loop() {
float h = dht.readHumidity();
float t = dht.readTemperature();
if (isnan(h) || isnan(t)) {
Serial.println("Failed to read from DHT sensor!");
}
Serial.print("Temperature: ");
Serial.print(t);
Serial.print(" degrees Celcius Humidity: ");
Serial.print(h);
Serial.println("% send to Thingspeak");
ThingSpeak.writeField(myChannelNumber, 1,t, myWriteAPIKey);
ThingSpeak.writeField(myChannelNumber, 2,h, myWriteAPIKey);
}


